Profiling First, Prompting Second: Using AI to Optimize Slow Code
How to structure AI-assisted performance work — what profiling data to share, how to frame bottlenecks, and how to validate that a suggested fix actually helps.

Performance work is where AI assistants can genuinely help — and where they can confidently lead you in the wrong direction. The difference is whether you give the model something real to work with: profiling data, concrete numbers, and a clearly stated bottleneck. Without that, you’re asking it to guess.
The problem with “make this faster”
The worst way to use AI for performance work is to paste slow code and ask “how do I speed this up?” The model will produce something — usually syntactically clever, often plausible — but it has no way to know where the time is actually going. It will optimize the part that looks expensive, which is rarely the same as the part that is expensive.
The discipline here is the same one that applies to human performance work: measure first, then optimize. The difference with AI is that you then need to make those measurements available to the model before asking it to do anything.
Give the model your profiling output
Before you involve an AI assistant, run a profiler and capture the output. What you share depends on your stack, but the principle is the same: give the model concrete data about where time is being spent.
For a Node.js application:
# Profile a specific operation with the built-in profiler
node --prof server.js
node --prof-process isolate-*.log > profile.txt

# Or with clinic.js for a flame graph
npx clinic flame -- node server.js
For a Python function:
import cProfile
import pstats

profiler = cProfile.Profile()
profiler.enable()
# ... run the slow operation ...
profiler.disable()

stats = pstats.Stats(profiler)
stats.sort_stats("cumulative")
stats.print_stats(20)  # top 20 functions by cumulative time
Paste the profiling output into your conversation alongside the relevant code. A model told “the profiler shows 78% of time in serialize_batch, specifically in json.dumps on line 44, called 50,000 times per request” is calibrated to a completely different problem than one told “the endpoint is slow.”
Frame the problem with numbers and constraints
Profiling output shows where time goes. You also need to give the model the target — what “fast enough” looks like — and the constraints it can’t see from the code.
## Performance problem

Current: /export endpoint takes 12-14s for a 10,000-row result set.
Target: under 2s for the same input.

Profiler output (top 10 by cumulative time):
  12.3s  serialize_batch (called 1x)
   8.1s  json.dumps (called 50,312x inside serialize_batch)
   3.9s  format_row (called 50,312x)
   0.2s  db.query (not the bottleneck)

Constraints:
- Rows are independent — no cross-row dependencies in serialization.
- Output JSON shape is fixed — client contract, can't change.
- Can't add external dependencies without approval.
That last block — constraints the model can’t see from the code — is load-bearing. “Rows are independent” tells the model that parallelism is safe. “Output format is fixed” prevents it from proposing a binary format. Without constraints, you will get suggestions that are technically faster but break requirements.
Ask for a diagnosis before a fix
Performance suggestions are easier to evaluate when you see the reasoning. Before asking for code changes, ask the model to explain why the bottleneck exists:
Here's the profiling data and the relevant serialize_batch code.

Before suggesting changes: explain what's causing 78% of time in
json.dumps. Then list the 2-3 highest-leverage optimizations and
the order-of-magnitude improvement you'd expect from each.
This produces an analysis you can sanity-check. If the model says “using orjson instead of the stdlib json module typically gives 3-5× for this pattern,” you can verify that claim independently before writing a line of code. If it says “the real problem is calling json.dumps 50,000 times instead of once on the whole structure,” you understand the shape of the fix before you see the code.
Asking directly for the optimized code skips this calibration and gives you a patch you have no basis to evaluate.
Benchmark before and after, explicitly
AI assistants will tell you their suggestion is faster. Don’t take that on faith. Establish a baseline benchmark before applying any change, run it, apply the change, run it again.
import timeit

def benchmark(fn, label, n=10):
    times = timeit.repeat(fn, number=1, repeat=n)
    avg = sum(times) / n
    print(f"{label}: {avg * 1000:.1f}ms avg over {n} runs")

# Baseline — run this before touching the code
benchmark(lambda: serialize_batch(test_data), "baseline")

# Apply the model's suggestion, then measure again
benchmark(lambda: serialize_batch_v2(test_data), "optimized")
This matters more than it seems. Models occasionally suggest changes that don’t improve performance for your specific input size, or that trade one overhead for another they didn’t account for. Benchmarking makes this visible in 30 seconds instead of a confusing conversation about why production is still slow.
One requirement: benchmark with data that matches production in size and shape. A 20-row test fixture is not a useful proxy for a 50,000-row production result set.
A lesson learned: I accepted an AI suggestion to consolidate N individual database queries into a single
INclause query. It was obviously correct and sounded fast. It was — for my test data of 20 rows. In production with 50,000 rows, theINclause caused a full table scan that was slower than the individual queries. The fix was right in principle, wrong at scale. A benchmark with realistic data would have caught it in 30 seconds. Now I always profile and benchmark with production-scale inputs, not test fixtures.
Watch for local vs. system-level optimizations
Language models are good at micro-optimizations: avoiding unnecessary allocations, picking faster data structures, reducing serialization overhead. They are worse at system-level questions: whether to add a cache layer, whether to parallelize across worker threads, whether the real answer is a different architecture.
If your profiling shows a function is called 50,000 times per request, local optimization might make each call 3× faster. That is meaningful. But the system-level question — “should this be called 50,000 times at all?” — is often the higher-leverage one, and it is harder for the model to see from a single function’s code.
When you share profiling data, explicitly flag what looks surprising about the call counts:
format_row is called 50,312 times per request. That number comes from
the number of rows × 5 columns being formatted individually. The function
currently processes every column for every row even when only 2 columns
changed. Is there a smarter dispatch here, or should this be batched?
This steers the model toward the architectural question rather than polishing the inner loop.
Recognize when AI isn’t the right tool
Some performance problems are not well-served by an AI assistant:
Cache invalidation design requires your domain knowledge about read/write ratios, consistency requirements, and failure modes. The model can explain cache strategies in general; it cannot tell you which TTL is right for your access pattern.
Database query planning benefits from EXPLAIN ANALYZE output — paste it in and the model can often explain what the planner chose and why. But interpreting that output correctly requires understanding your data distribution and index statistics. Share both.
Concurrency bottlenecks — thread contention, lock ordering, and races under load — are hard to diagnose from static code. Use a purpose-built tracing tool first. Once you have a trace, the model is useful for understanding what it shows.
For these problems, the productive use of AI is narrow: explain what a profiler output means, suggest where to instrument next, translate a solution you’ve designed into working code.
The sequence that works
The pattern that reliably produces useful AI-assisted performance work:
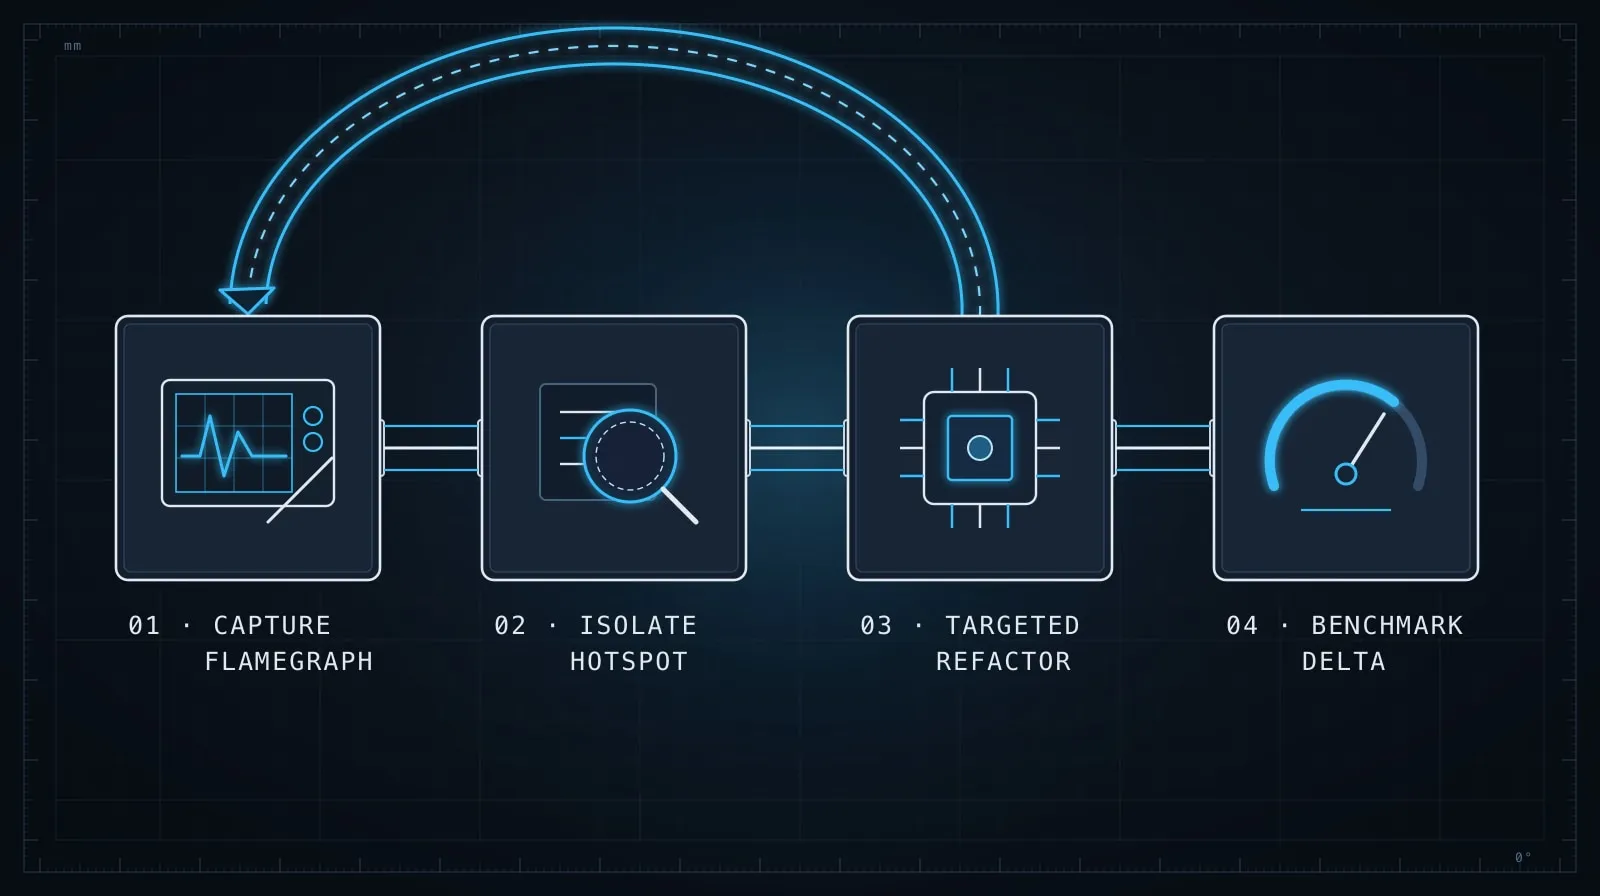
- Profile with realistic data. Get actual numbers, not intuition.
- Identify the real bottleneck from the profiling output.
- Share both the profile and the code with the model.
- State the constraints the model can’t see: what you can’t change, what production scale looks like.
- Ask for a diagnosis first, then optimization candidates.
- Benchmark the suggestion before applying it to the codebase.
- Profile again after the change to confirm you solved the right thing.
Performance work is inherently empirical. AI can accelerate the “generate candidate optimizations” step and help you reason about profiling output — but the measurements have to come from your system. The model’s intuition about what’s slow is probabilistic; your profiler’s output is ground truth.
For the same measurement-before-change discipline applied to bugs, see Debugging with LLMs: Give the Model What It Can’t Guess. And for keeping your context clean when iterating through multiple optimization attempts in a single session, Managing Context in Long AI Coding Sessions covers how to checkpoint decisions without dragging resolved dead-ends into every exchange.