Using AI to Analyze Logs and Diagnose Production Incidents
A practical workflow for feeding production logs to an LLM to surface root causes, correlate errors, and cut mean-time-to-resolution — without leaking sensitive data.
When production breaks, you usually don’t get a failing test and a clean stack trace. You get hundreds of log lines from four different services, timestamps that don’t quite align, and a support ticket that says “users can’t check out.” The debugging techniques from a development environment — step through the code, reproduce locally, read the error — don’t always transfer. What you actually need is pattern recognition across a lot of noisy data, and that’s something LLMs do well.
This post covers a practical workflow for using AI to diagnose production incidents from logs: how to prepare log data for analysis, how to structure your prompts, and where the technique breaks down.
Why logs are a good fit for AI analysis
LLMs have been trained on enormous amounts of software documentation, error messages, and discussion about production failures. When you paste a Java NullPointerException trace or a Postgres deadlock message, the model usually recognizes the pattern immediately — not because it’s “smart,” but because it has seen thousands of similar errors described in documentation and Stack Overflow threads.
The second reason is correlation. During an incident, the hard part is usually not understanding any single log line — it’s connecting the dots: the 401 from the auth service at 14:32:05 that caused the retry storm in the order service at 14:32:08 that triggered the database connection exhaustion at 14:32:11. Humans do this well but slowly. LLMs can hold several hundred lines of interleaved log output and identify the causal chain in one pass.
Preparing logs before you paste
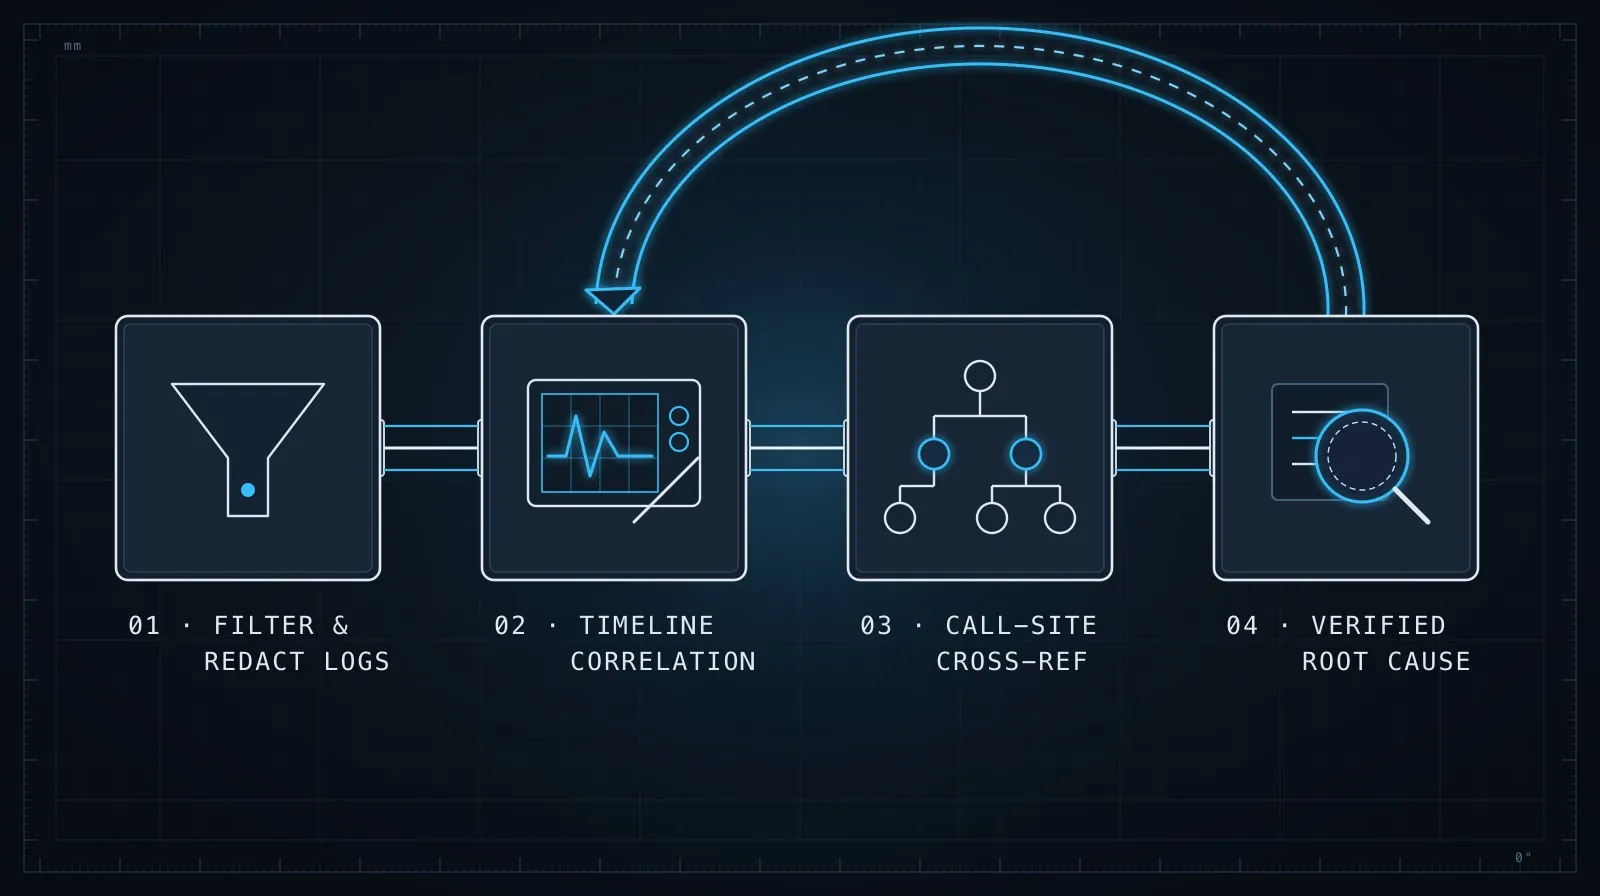
Raw production logs are usually too long, too noisy, and too sensitive to paste directly. Three preprocessing steps before you involve AI:
1. Redact sensitive data. Logs routinely contain PII, session tokens, API keys, and internal hostnames. Do not paste these into an external model API. Either use a locally-hosted model, run a quick redaction pass with sed, or use a purpose-built log sanitizer. At minimum:
# Replace email-like strings and UUIDs before sharing
sed -E \
  -e 's/[a-zA-Z0-9._%+-]+@[a-zA-Z0-9.-]+\.[a-zA-Z]{2,}/[EMAIL]/g' \
  -e 's/[0-9a-f]{8}-[0-9a-f]{4}-[0-9a-f]{4}-[0-9a-f]{4}-[0-9a-f]{12}/[UUID]/g' \
  -e 's/Bearer [A-Za-z0-9._-]+/Bearer [TOKEN]/g' \
  production.log > sanitized.log
2. Narrow the time window. Extract logs from 2–5 minutes around the incident start, not the entire day. A 400-line window is far more useful than 40,000 lines where the model has to find the signal.
# Extract logs between two timestamps (adjust format for your logger)
awk '/2026-08-21T14:30/,/2026-08-21T14:35/' sanitized.log > incident.log
3. Tag the source. If you’re merging logs from multiple services, prefix each line so the model knows where it came from:
paste -d'\n' \
  <(sed 's/^/[auth-service] /' auth.log) \
  <(sed 's/^/[order-service] /' order.log) \
  | sort > merged.log
Sorted, tagged, redacted — now you have something worth analyzing.
The incident analysis prompt
A vague prompt produces a vague diagnosis. Structure the request so the model understands what kind of answer you need:
You are a senior backend engineer diagnosing a production incident.
Below are logs from three services during a checkout failure incident
(2026-08-21 14:30–14:35 UTC). Customer reports: users receiving 500
errors on /checkout for approximately 4 minutes starting ~14:31.

Your task:
1. Identify the root cause event — the first failure that triggered
   the cascade, not just the symptoms.
2. Show the causal chain: which service failed first, which failures
   were downstream consequences.
3. Point to the specific log lines that support your conclusion.
4. Suggest 1-2 things to check in the code to confirm the root cause.

Logs:
[paste merged.log here]
The instruction to “point to specific log lines” is important. Without it, you get a plausible narrative with no way to verify it. With it, you get something like: “The root cause appears at line 47: [auth-service] ERROR token validation failed: redis connection timeout. The subsequent 401s from the auth service starting at line 52 are consequences, not causes.” That’s actionable.
Cross-referencing logs with code
Once you have a suspect — say, the Redis connection timeout — the next step is checking the code that owns that path. This is where you shift from log analysis to code analysis, and a clean handoff between the two prompts works better than one giant prompt:
The root cause of our incident was a Redis connection timeout in the
token validation path. Here is the relevant code:

[paste auth/token.ts or equivalent]

Questions:
1. Does this code have a connection timeout configured? What is it?
2. Is there any retry logic? If not, does a single Redis timeout cause
   every in-flight request to fail immediately?
3. What would need to change to make this path resilient to a brief
   Redis blip — connection pooling, a fallback, a shorter timeout with
   retries?
The separation matters. The log analysis prompt is about finding what happened; the code analysis prompt is about understanding why and what to fix. Combining them into one massive prompt tends to produce a weaker answer to both questions.
When the model gets it wrong
AI log analysis has a specific failure mode: confident wrong hypotheses. A model will sometimes latch onto a prominent-looking error — a stack trace that takes up 30 lines — and treat it as the root cause when it’s actually a downstream consequence. You can defend against this with an explicit instruction:
Important: distinguish root causes from symptoms. Many of the errors
in these logs will be consequences of a single upstream failure. I'm
specifically interested in the FIRST failure in the causal chain, not
the most visible one.
Also cross-check the model’s conclusion against the timestamps. If it claims service A caused service B to fail, A’s error should appear before B’s. If the timestamps say otherwise, the model has the causality backwards and you should push back.
Post-incident: using AI for the write-up
Once the incident is resolved, AI can significantly speed up writing the post-mortem. Give it the incident timeline, the root cause, and the fix, and ask for a draft:
Write a post-mortem for the following incident. Use this structure:
- Summary (2-3 sentences)
- Timeline (key events with timestamps)
- Root Cause
- Contributing Factors
- Resolution
- Action Items (preventive measures, not just the immediate fix)

Facts:
- Incident: checkout 500 errors for 4 minutes on 2026-08-21
- Root cause: Redis connection timeout in token validation had no retry
  logic; a brief Redis restart caused all in-flight auth requests to fail
- Fix: added retry with exponential backoff in auth/token.ts
- Contributing: no health check alerting on Redis; timeout was 30s (too long)
- Action items: add Redis health alert, reduce timeout to 3s with 3 retries,
  add integration test for Redis unavailability
The model will produce a readable draft that you edit, not publish verbatim — but getting from bullet points to coherent prose in one pass is a meaningful time save when you’re writing a post-mortem after a long incident.
Token limits and long log files
The practical ceiling for log analysis in a single prompt is roughly 2,000–5,000 lines depending on the model. Beyond that, either the context window fills or the model’s attention degrades on the early content. Two strategies when logs are larger:
Pre-filter by log level. If you’re diagnosing an error, grep -E 'ERROR|WARN|FATAL' before pasting. You lose context but focus the model on the signal.
Analyze in segments. Run the same analysis prompt across sequential 300-line windows, then synthesize: “Here are the findings from three time windows. What is the most likely root cause across all of them?” This is slower but handles log files the model can’t hold all at once.
The discipline this requires
AI log analysis is not “paste logs, get answer.” It requires the same hygiene as any LLM task: narrow the input, be specific about what you want, verify the conclusion against the raw data, and know the failure modes.
What it does give you is a significant head start. A model that can scan 500 log lines and identify the likely causal chain in 20 seconds is a valuable first responder — it narrows the search space so you spend your time confirming a hypothesis rather than building one from scratch.
For the code fix that follows the diagnosis, the prompting patterns in Debugging with LLMs: Give the Model What It Can’t Guess apply directly — the same principle of giving the model a precise, scoped context rather than a vague problem description. And if the incident reveals a need to add observability, Evaluating AI-Generated Code Before It Ships covers the checklist for making sure the fix doesn’t introduce new failure modes.